Related pages
In this section
-
Key findings
-
Source localization
-
Imaging of brainstem and cerebellum
-
Early visual processing
-
Visual perception
-
Face processing
-
Attention
-
Music perception
-
Sleep
-
Eye movements
-
Somatosensation
-
Single trial variability
-
Patients
-
Data analysis overview
Somatosensation
Stimulus induced and perception driven activity in SI
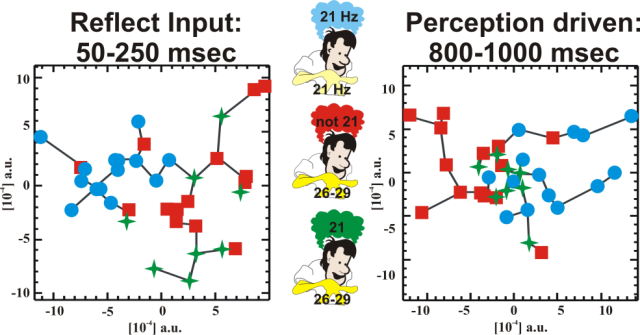
Four right-handed males participated in a frequency discrimination task to detect changes in the frequency of an electrical stimulus applied to the right-hand digits. The subjects received approximately 600 pairs of stimuli with the first stimuli always at 21 Hz, while the second was either 21 Hz (50%) or varied from 22 to 29 Hz in steps of 1 Hz. The task of the subject was to guess the frequency of the second stimuli.

Comparison between SI activity at early and late periods. Multidimensional scaling is
used to reduce each trial to a point. The geometry describing the different classes of trials reflects only
the physical properties of the stimulus in the early period (left) but by the end of the stimulus
presentation (right) the trials corresponding to 26-29 Hz stimulation but erroneous (21 Hz) perception
(green) are clustered in between the correctly estimated responses at 21 (blue) and 26-29 Hz (red).
In this study we have identified a time-dependent response in the primary somatosensory cortex, SI. During the first few hundred milliseconds the activity in SI is driven exclusively by the properties of the stimulus, but after half a second the activity of SI reflects what the subject thinks the stimulus is, even while a different external stimulus is present.
L. C. Liu et al., Neuroscience 121, 141-154 (2003). PDF >>
Somatosensory activity in brainstem and cerebellum
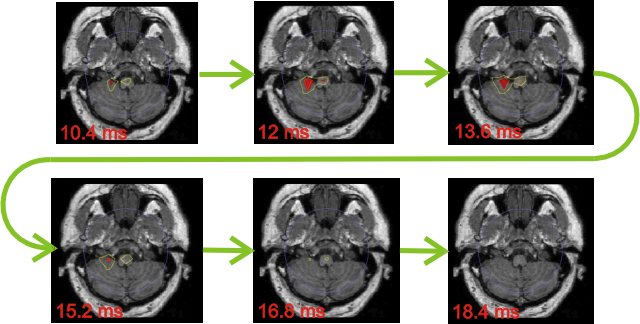
Four normal right-handed subjects were studied, using electrical stimulation of the median nerve in each arm at the wrist. The intensity of the stimuli were set so as to produce a motor response of the thumb. Thus both sensory and antidromic motor volleys ascended to the cord.

This set of axial MRIs shows the sensory volley ascending through the brainstem starting at 10.4 ms and ending at 18.4 ms. The spread in time reflects both the duration of the volley and variability across single trials. The contours encompass statistically significant activity, yellow for P < 10-5 and red for P < 10-7. The first 10 single trials for left arm stimulation are compared to the noise runs (runs with subject in place and no stimulation). Activity is significant in gracile and cuneus nuclei. And ipsilateral to the gracile cerebellar lobe. Note short activation of the cerebellum.