Related pages
In this section
-
Key findings
-
Source localization
-
Imaging of brainstem and cerebellum
-
Early visual processing
-
Visual perception
-
Face processing
-
Attention
-
Music perception
-
Sleep
-
Eye movements
-
Somatosensation
-
Single trial variability
-
Patients
-
Data analysis overview
Source localization accuracy and precision
To see the detailed figure legends hover the mouse over the figures
Comparison of MEG (using MFT) and fMRI localization
The comparison of MEG (using MFT for source localization) and fMRI estimates of neural activity in V1, elicited by identical stimuli (circular checkerboard pattern with radius of ~5� presented in the lower visual field at 8� eccentricity) in the same subjects. Every precaution was taken to optimize each method so that failure to identify common loci within V1 could not be attributed to technical limitations or contributions from extrastriate areas.
Comparison of V1 activation between fMRI and MEG at the onset of M50 (42.4 ms). The
results are shown in the paracalcarine slice best covering V1 for each subjects. Lower row shows the
corresponding magnified views. Blue outlines mark indicates the boundary of statistically significant fMRI
activations (P < 0.01) and white dashed circles mark the estimate for the targeted area. For MEG yellow
and red outlines mark the P < 0.05 and P < 0.001 contours, respectively, and filled red contours denote
regions with statistically significant activations within 50% of the peak t value.
MEG data showed that activity arrives in V1 ~40 ms, and then within a few milliseconds spreads to neighbouring extrastriate areas. MEG and fMRI estimates within V1 matched extremely well. The mean (SD) distance between the earliest activation estimates was 3.8 (1.7) mm.
F. Moradi et al., Neuroimage 18, 595-609 (2003). PDF >>
Localization precision across visual cortex
Three male subjects participated in the experiment where checkerboard pattern stimuli were presented at eight different locations in the parafoveal and peripheral visual fields. For each subject the same experiment was repeated on three different days, months apart. The precision of the localization was defined as the SD of the activation locations across three experimental days.
Responses in areas V1, V4, V5/MT+, vPOS and dPOS. ROI centres identified in the left
hemisphere in response to right hemifield stimulations. The solid gray line on each axial MRI slice together
with the X Talairach coordinate in the lower right corner for each area indicate the location of the
corresponding sagittal slice. White arrows point to the parieto-occipital sulcus (POS), and calcarine sulcus
(CS). Insert in the upper left corner shows the schematic image of the stimuli. Coloured symbols are depicted
to indicate the correspondence between the stimulated locations, and identified ROIs; they were not presented
to subjects. Triangles and diamonds indicate lower and upper; and cyan and yellow, peripheral and parafoveal
visual field stimulations, respectively. The green lines on the sagittal slice showing the localization
results for V1 indicate the V1/V2 borders (representation of vertical meridian), which were obtained in a
separate fMRI experiment. ROI timecourses for three days (red - Day 1, blue - Day 2, green - Day 3) are
superimposed. The black, filled circle in the schematic image of stimuli displayed on the upper left part of
each figure indicates the stimulated location of the visual field for the timecourses displayed in that
figure. POS, parieto-occipital sulcus; vPOS, ventral POS; dPOS, dorsal POS.
The localization precision was typically within 2 mm in all areas (V1, V4, V5/MT+, vPOS and dPOS). We identified also the precise timing of these areas, which was very reproducible across different experimental days. POS, parieto-occipital sulcus; vPOS, ventral POS; dPOS, dorsal POS.
V. Poghosyan, A. A. Ioannides, Neuroimage 35, 759-770 (2007). PDF >>
Localization accuracy from simulated MEG data
Simulated MEG signal was generated so as to closely mimic the real experimental data. The signal recorded during the real 'subject noise' run was used as 'background noise' for the simulated data. Dipoles were placed in V1, V4, V5/MT+, vPOS and dPOS areas and were activated with overlapping timecourses.

Simulated data.Source dipoles (light blue arrows) together with their MFT/SPM estimates
(yellow contours). Sagittal slices of MR images where the dipoles were placed are shown. Yellow contours
encompass the regions with a statistical significance of P < 0.000001. Names of the areas are given on top
of each MRI. The distance between the dipoles location and the centroid of its estimate is indicated next to
each dipole. Latencies of the estimated activations are shown at the bottom of each MRI. POS,
parieto-occipital sulcus; vPOS, ventral POS; dPOS, dorsal POS.
The figure shows the simulated source dipoles (light blue arrows) together with their MFT/SPM estimates (yellow contours, P < 0.000001). The distance between the dipole's location and its MFT estimate is indicated next to each dipole. On average the localization accuracy was 2.3 mm. POS, parieto-occipital sulcus; vPOS, ventral POS; dPOS, dorsal POS.
V. Poghosyan, A. A. Ioannides, Neuroimage 35, 759-770 (2007). PDF >>
Localization accuracy from phantom data
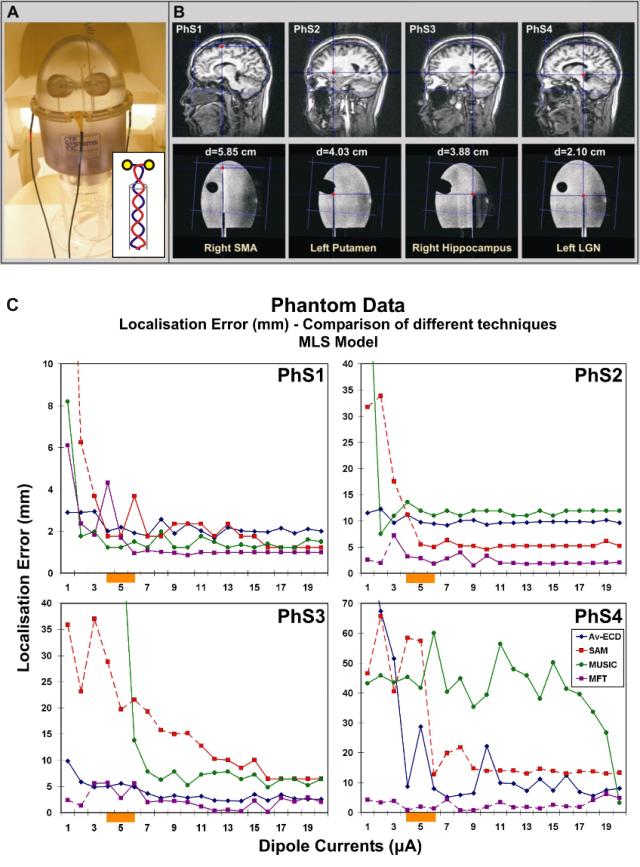
The detection and localization capabilities of several commonly used source estimation methods (ECD, MUSIC, SAM and MFT) were investigated under a wide range of difficulty conditions and current source strengths using a head-shaped phantom.

Phantom data. (A) The spheroidal phantom placed in the MEG helmet. The total phantom
height is 372.8 mm, and the plastic wall thickness 5 mm. It has a plastic spheroid globe of an elliptical
vertical cross section with inner dimensions of 130 X 185.72 mm. The smooth inner surface of the phantom is
interrupted by two plastic constructions that mimicked the effect of eye sockets in a real head. The inset
shows a schematic representation of the inserted physical dipoles. (B) The four dipole locations over-plotted
on the phantom's MRI scans. Each location corresponds roughly to one structure of the brain (the
supplementary motor area (SMA), the putamen, the hippocampus, and the lateral geniculate nucleus (LGN))
representing the full range of difficulty in localizing generators in the brain. The distance of the dipole
from the centre of the spheroid, d, is printed in cm for each case. (C) The localization error (LE in mm)
versus the dipole current (in mF) using the multiple local spheres (MLS) conductivity model. Dashed lines
show values with no significant t-values for SAM. For MFT, dashed lines represent LE of MFT derived from the
average signal (used when MFT analysis of single trial data produced no significant t-values).
The results show that MEG, independent of source analysis method, has a very good localization accuracy of 2-3 mm for superficial sources, even when the sources are weak and a small number of trials are used. The sources in subcortical areas such as in putamen, hippocampus and amygdala can be localized with good accuracy (5 mm) provided that an appropriate source analysis method is used. The activity generated by deep "thalamic" source (within about 2 cm from the center of the head) was possible to localize with a satisfactory accuracy (1 cm or better) provided that sufficient trials were available for improving the SNR of the signal.
Among the investigated methods MFT showed the most robust and accurate performance.
C. Papadelis et al., Clin.Neurophysiol. 120, 1958-1970 (2009). PDF >>
Localization of responses in brainstem
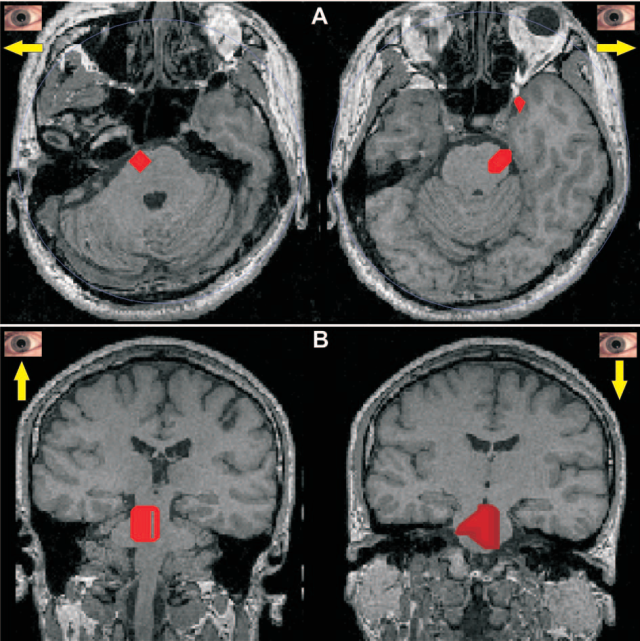
The MEG signals were recorded from three subjects while they performed a simple cued eye movement task.

Statistical parametric maps (SPMs) showing common activations in the brainstem for the 100 ms
period just before saccades. In each case the SPMs were computed for each subject separately by
comparing the moduli of the current density in the 100 ms leading to the saccade with the corresponding
distributions in the far pre-stimulus period (-900 to -600 ms). The results were then transformed to the
Talairach space and common activations across subjects identified for each voxel. The results were then
backtransformed to the MRI of one of the subjects for display. (A) Shows the SPMs for horizontal eye
movements (move left on left and move right on right) and (B) shows the SPMs for vertical eye movement (move
up on left and move down on right). The red area corresponds to voxels of common statistically significant
increase (P < 0.05) for all three subjects in the first three directions, but for only two subjects in
down, possibly because for down, the subject produced fewer saccades satisfying the selection criteria.
The results of this study demonstrate that activity in the pontine gaze centers can be imaged millisecond by millisecond. The estimated activity pattern in brainstem was consistent with the known anatomy and functional organization of gaze centers. Taken together these results demonstrate the feasibility of accurate imaging of brainstem centers in both the awake state and during sleep. They therefore extend to the level of the brainstem the claim for accurate localization using post-MFT statistical analysis of non-invasive MEG signals.
A. A. Ioannides et al., Cereb. Cortex 14, 56-72 (2004). PDF >>