Related pages
In this section
-
Key findings
-
Source localization
-
Imaging of brainstem and cerebellum
-
Early visual processing
-
Visual perception
-
Face processing
-
Attention
-
Music perception
-
Sleep
-
Eye movements
-
Somatosensation
-
Single trial variability
-
Patients
-
Data analysis overview
Patient studies
Schizophrenia
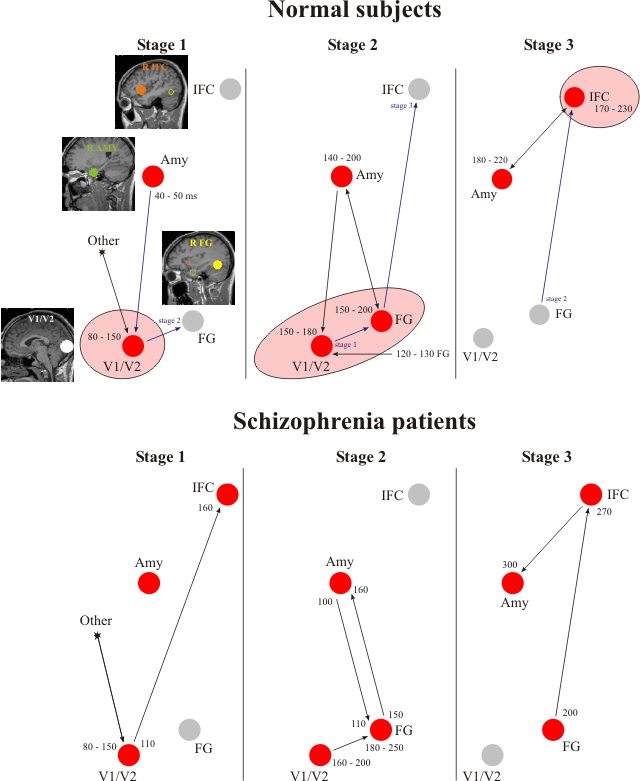
Fifteen partly remitted schizophrenic inpatients and 12 healthy volunteers categorized facial expressions of emotion (neutral, happiness, fear, anger, surprise, disgust and sadness) while their brain responses were recorded using MEG. After computing the single trial neural activations throughout the brain using MFT, mutual information based dynamic network was constructed from activity in four right-hemisphere areas known to be involved in the processing of faces or facial expressions of emotion: V1/V2, the fusiform gyrus (FG), the inferior frontal cortex (IFC) and the amygdalae (Amy).

Mutual information (MI) based networks for normal subjects and schizophrenia patients.
The networks are constructed by computing MI from pairs of time courses between all possible pairs formed
between any two of the following areas: right amygdala, V1/V2, right fusiform gyrus (FG) and right inferior
frontal cortex (IFC). The anatomical locations of these functionally defined areas are shown (in different
colour) on sagittal slices in the first figurine. The areas active during the displayed stage are in red and
others are in gray. Within-stage inter-area connections are represented by black arrows and links between
hubs marking the transition between stages are represented by blue arrows. The numbers in the figure indicate
latencies from stimulus onset in milliseconds. For connections, the latency of the source area initiating the
linked activity is placed at the tail and the latency of the target area at the head of the arrow. Upper row:
Controls, lower row: schizophrenia patients.
The network constructed from the data of normal subjects (upper row) shows three well defined stages of neural processing, with hubs first in V1/V2, then V1/V2 and the FG, and later still in the IFC, as indicated here by highlighting and pale red shading. In schizophrenia patients (lower row) however no such well-defined stages of processing exist. Instead, the activations, although strong, are poorly linked to each other, managing only isolated links between pairs of areas. These results provide evidence for disturbances in functional connectivity in schizophrenia based on real time data analysis and contribute substantially to the definition of the so-called endophenotype of the disease.
A. A. Ioannides et al., Neuroimage 23, 473-482 (2004). PDF >>
Paraplegia
In this study we compare brain activity in three paraplegic and two normal subjects in a GONOGO task, where visual stimuli (arrows to the left or right) instructed subjects to move (green arrow, GO trials) or inhibit movement of (red arrow, NOGO trials) either a left or right index finger or the foot.

Time course of activity in early visual cortex (V1/V2) and posterior parietal cortex
(PPC). Signal to noise ratio (SNR) time courses derived from responses in right hemisphere V1/V2
(upper row) and PPC (lower row), for left finger (left column) and foot (right column) movements in NOGO
trials. The time courses from patients (blue) and controls (red) are overplotted.
The figure shows the time course of activity (signal to noise ratio (SNR) generated from single trial regional activations) in two critical cortical regions, early visual cortex (V1/V2) and the posterior parietal cortex (PPC). Note that the time courses are shown for NOGO condition (no movement is required). For finger movement, the activity was similar in paraplegics and normals in both regions. For foot movement, the activity in V1/V2 was similar in the two groups, but activity in PPC was significantly decreased in paraplegics compared with the normals, even in NOGO condition, where no movement was required. This shows that in spinal cord injury patients, impairment is present not only in motor cortex, but also in predominantly sensory parietal areas, where visuomotor transformations are implemented.
The below animations show brain activity in "foot movement" runs in GO condition. The period from -100 to 400 ms with respect to cue onset (green arrow pointing to right) is shown. The activity is projected on the left hemisphere cortical surface (views from left side are shown, slightly tilted, so as to better show the central sulcus, with the front of the brain on left side, back of the brain on the right side), the negative and positive values indicate inward and outward current directions respectively. The color bar on the top right corner of the animation shows the color coding of response magnitude, which is normalized for each time point. The global norm value (denoted with "norm:", across all time points, -100 to 400 ms) is shown at the bottom, separately for negative (inward current) and positive (outward current) currents. The latency in milliseconds with respect to cue onset is also shown at the bottom (denoted with "time (ms):").