Related pages
Key findings
Some of our key findings
To see the detailed figure legends hover the mouse over the figures
In this section you can find some of our most important findings. Use the left pane to navigate to specific themes.
Latest findings:
Early emotion separation in the brain
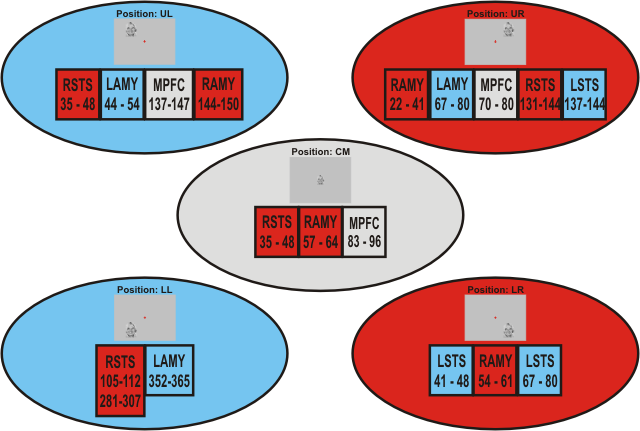
In a face affect recognition task, faces with fearful, happy and neutral expressions were presented to subjects at the centre and in each quadrant of visual field.

Time ranges for emotion separation in
bilateral amygdala (AMY), superior temporal sulcus (STS), and medial
pre-frontal cortex (MPFC). The times are printed inside the
boxes in millisecond. Images were presented at either the centre or one
of the quadrants. Gray, blue and red ovals represent fovea, left and
right visual field presentation, respectively. In case of STS and AMY
activations, boxes in the same colour as the background oval denote
ipsilateral activity while in different colour denote contralateral
activity.
Here we show response latencies (in ms post-stimulus) and brain regions that first separate different emotions. The results show that the separation is processed differently depending on where in the visual field the stimulus is presented. Superior temporal sulcus (STS) and amygdala play key, but different roles in early visual processing, recruiting distinct neural networks for action: the amygdala alerts sub-cortical centers for appropriate autonomic system response for fight or flight decisions, while the STS facilitates more cognitive appraisal of situations and links appropriate cortical sites together. STS, superior temporal sulcus; RSTS, right STS; LSTS, left STS; AMY, amygdala; LAMY, left AMY; RAMY, right AMY; MPFC, medial pre-frontal cortex.
The separation at the upper right visual field appeared fastest among all the visual field presentations. This effective separation of emotions may be attributed to the tendency of leftward bias when holding a newborn young infant: a leftward held infant will have the face of its mother in the upper right quadrant of the visual field. The evolutionary pressure would thus have favoured selective pruning of connections supporting the analysis of the more frequently occurring encounters with the salient stimuli of the carer's face.
L. C. Liu, A. A. Ioannides, PLoS One 5, e9790 (2010). PDF >>
Earliest attentional effect in the primary auditory and visual cortices
This study addressed a fundamental question about the neural correlates of attention, namely what is the earliest sensory processing stage that attention affects.

Earliest visual spatial attention related activations
(responses to images presented in the left visual field). (On
the left) Brain regions modulated by spatial attention for both visual
stimulus categories (checkerboards and faces) are shown in three
consecutive time intervals. Axial MRI slice that best covers the
activations is shown on the upper row. The sagittal view of the first
significant activation that was localized in V1 in 55-60 ms interval is
shown below. The green lines here indicate the V1/V2 borders
(representation of vertical meridian), which were obtained in a
separate fMRI experiment. The white dotted line on the axial view shows
location of the sagittal slice. Yellow contours encompass the regions
of statistically significant (P < 0.005) activations. Red colour
indicates the strongest activated regions. Next to the sagittal view,
the schematic image of the activation location in V1 is shown. (On the
right) Activation time course of right hemisphere V1 generated in
response to checkerboards presented in the right visual field, in the
attended (blue) and ignored (red) conditions overplotted.
In contrast to earlier accepted view this study demonstrated that the earliest feedforward stimulus-evoked response in the primary visual (auditory) cortex, at ~50 ms (25 ms), is enhanced by spatial attention. Attentional modulation of visual sensory processing starts in V1 and, together with the feedforward volley of activation, spreads through the visual cortex.
V. Poghosyan, A. A. Ioannides, Neuron 58, 802-813 (2008). PDF >> Suppl PDF >>
Localization accuracy from phantom data
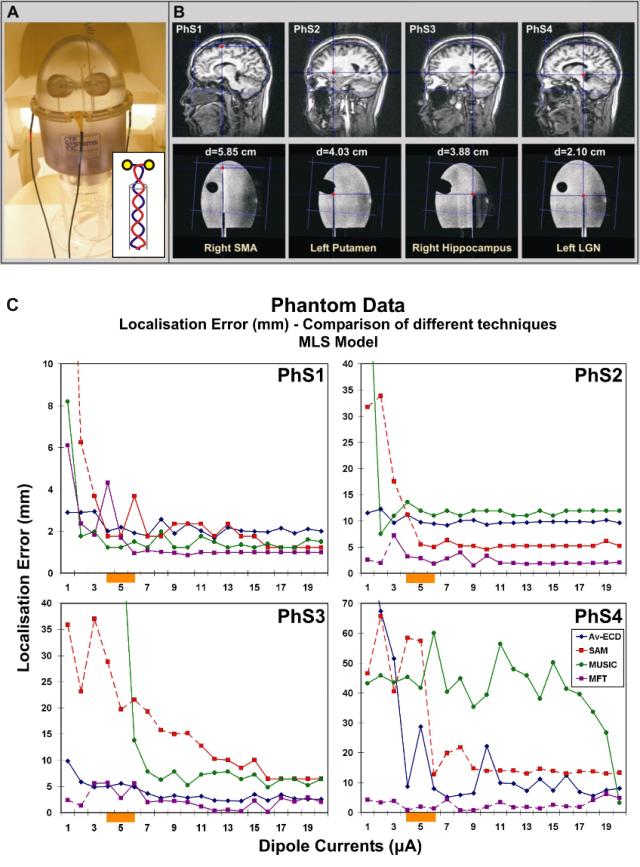
The detection and localization capabilities of several commonly used source estimation methods (ECD, MUSIC, SAM and MFT) were investigated under a wide range of difficulty conditions and current source strengths using a head-shaped phantom.

Phantom data. (A) The spheroidal
phantom placed in the MEG helmet. The total phantom height is 372.8 mm,
and the plastic wall thickness 5 mm. It has a plastic spheroid globe of
an elliptical vertical cross section with inner dimensions of 130 X
185.72 mm. The smooth inner surface of the phantom is interrupted by
two plastic constructions that mimicked the effect of eye sockets in a
real head. The inset shows a schematic representation of the inserted
physical dipoles. (B) The four dipole locations over-plotted on the
phantom's MRI scans. Each location corresponds roughly to one structure
of the brain (the supplementary motor area (SMA), the putamen, the
hippocampus, and the lateral geniculate nucleus (LGN)) representing the
full range of difficulty in localizing generators in the brain. The
distance of the dipole from the centre of the spheroid, d, is printed
in cm for each case. (C) The localization error (LE in mm) versus the
dipole current (in mF) using the multiple local spheres (MLS)
conductivity model. Dashed lines show values with no significant
t-values for SAM. For MFT, dashed lines represent LE of MFT derived
from the average signal (used when MFT analysis of single trial data
produced no significant t-values).
The results show that MEG, independent of source analysis method, has a very good localization accuracy of 2-3 mm for superficial sources, even when the sources are weak and a small number of trials are used. The sources in subcortical areas such as in putamen, hippocampus and amygdala can be localized with good accuracy (5 mm) provided that an appropriate source analysis method is used. The activity generated by deep "thalamic" source (within about 2 cm from the center of the head) was possible to localize with a satisfactory accuracy (1 cm or better) provided that sufficient trials were available for improving the SNR of the signal.
Among the investigated methods MFT showed the most robust and accurate performance.
C. Papadelis et al., Clin.Neurophysiol. 120, 1958-1970 (2009). PDF >>