Related pages
In this section
-
Key findings
-
Source localization
-
Imaging of brainstem and cerebellum
-
Early visual processing
-
Visual perception
-
Face processing
-
Attention
-
Music perception
-
Sleep
-
Eye movements
-
Somatosensation
-
Single trial variability
-
Patients
-
Data analysis overview
Sleep
To see the detailed figure legends hover the mouse over the figures
Whole night MEG measurements were recorded with precise head localization and complete hypnogram definition, while subjects slept well in the magnetometer. Six subjects with regular sleep habits were selected for the experiment following assessments by written questionnaires and interviews. All six subjects slept for two consecutive nights in the laboratory. During the first night (adaptation) the subject slept in the preparation room on a replica of the MEG bed and helmet. The actual polysomnography and MEG recordings were obtained throughout the second night. Four subjects slept in the magnetometer the third night too, during which they were presented with auditory and somatosensory stimuli while asleep. So far we have analyzed only a small portion of the available data and present here some of the notable findings from that analysis.
Core features of sleep stages
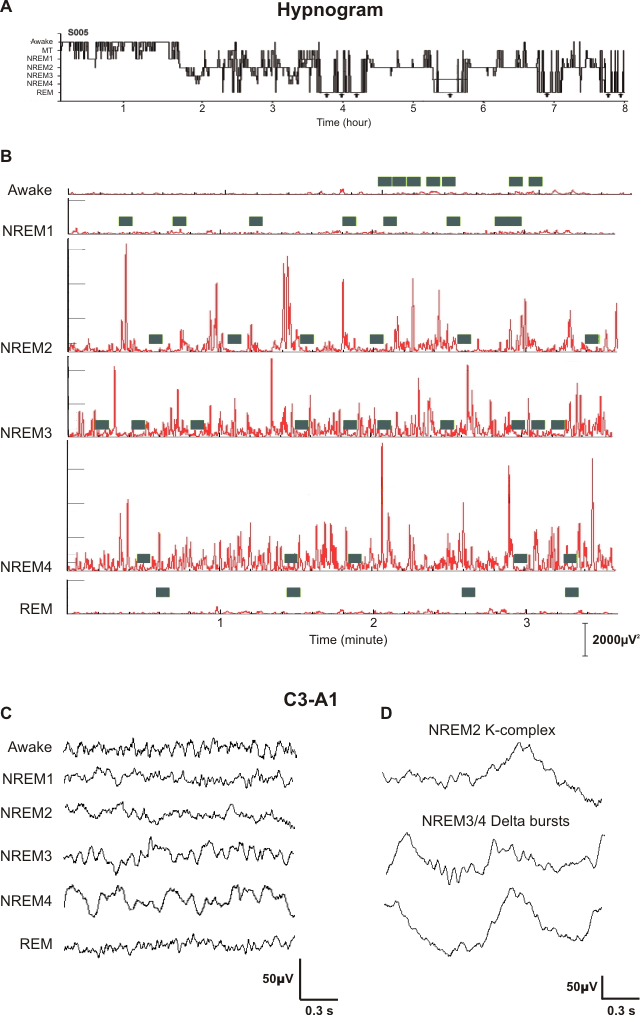
Different sleep stages are defined by unambiguous EEG electrophysiological signatures and have their own types of distinct mentation and behavior. Normal sleep shows a highly reproducible sequence of distinct stages that lead cyclically from light to deep non-REM (NREM) and then REM (random eye movement) sleep. These stages are defined by the short lasting epochs of the major graphoelements: vertex sharp waves in NREM stage 1 (NREM1); K-complexes and spindles in NREM2; high-voltage delta waves in NREM3/4; and eye movements and saw-tooth waves of REM.

Sleep core periods. (A) Hypnogram from one subject. (B) Three-minute EEG C3-A1 waveforms
(constructed by subtracting signal from EEG channel A1 from C3), squared and smoothed. The selected random
eye movement (REM) period is free of eye movements. Note quasi-periodic K-complexes and slow wave bursts in
non-REM (NREM) stages 2, 3 and 4. The green boxes indicate the four-second core periods with
lower voltage traces that have been defined and analyzed in the current study. (C, D) EEG C3-A1 waveforms.
(C) Two-second core periods: low voltage traces, from all sleep stages: from awake to random
eye movements (REM) stage, through non-REM (NREM) stages 1, 2, 3 and 4. (D) High voltage
graphemes: NREM2 K-Complexes; NREM3/4 high voltage delta. Note the different scales in figures C and
D.
The high-amplitude electrophysiological phasic events (see figures B and D) dominate each sleep stage, but they do not repeat in a consistent fashion and thus contribute to analyses in different amounts. They arise from low amplitude epochs (see figures B and C) which separate them. These relatively quiescent periods, which we callcore periods of sleep stages, reflect the shorter lasting periods of the cyclic alternating pattern in NREM and the tonic REM periods of REM sleep. In this study we analyzed these less studied periods to understand the brain functional organization underlying sleep stages. On the figure B the four-second core periods defined and analyzed in the current study are indicated with green boxes.

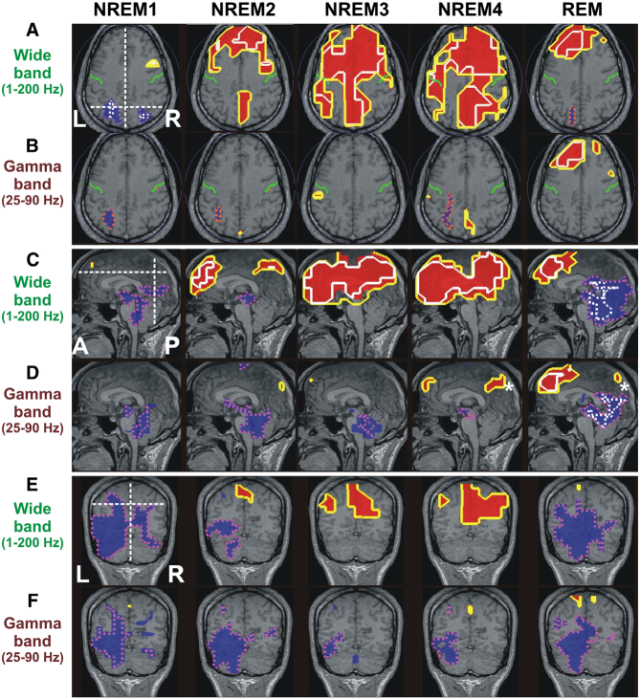
Significant brain responses when contrasting awake state with NREM1-4 and REM. Three
views, from top, axial (A, B), mid-sagittal (C, D) and coronal (E, F). The levels of other cuts are marked by
dotted white lines on the first slice of the odd rows. Left and right central sulcus in green. Wide-band,
upper rows; gamma-band, lower rows of each pair. Red fill with yellow contours mark common across-subject
increases in activity during sleep at P < 0.005, and white contours at P < 0.00001. Decreases are shown
as blue at P < 0.005, with dashed pink marking the boundaries; white dotted line, P < 0.00001. To avoid
clutter, the higher statistical significance contours (P < 0.00001) are shown for all REM cases but for
the rest only for the axial and the dorsal aspect of the sagittal slices. White stars in the NREM4 and REM
columns of (D) mark where the yellow contour was in NREM2.
The figure above shows the progression of brain regional activity with sleep stages. Pronounced activity is evident in the left dorso-medial prefrontal cortex (L-DMPFC) and the other areas around the dorsal midline that are close to, but do not overlap with areas attributed to Theory of Mind and default systems, both involved in introspection. These findings suggest that the DMPFC, particularly in the left hemisphere, plays an important role in late NREM stages, in REM and possibly in dreaming.
The gamma-band activity increases in precuneus during light sleep (stages 1/2) and in the L-DMPFC during deep sleep (stages 3/4). The L-DMPFC activated area expands laterally during REM sleep, into a volume of about 5 cm3 bounded by areas of Theory of Mind and the default systems. Gamma band activity in this area was higher during REM sleep than other sleep stages and active wakefulness.
A. A. Ioannides et al., Neuroimage. 44, 455-468 (2009). PDF >>
See also A. A. Ioannides et al., Cereb. Cortex 14, 56-72 (2004). PDF >>