Related pages
In this section
-
Key findings
-
Source localization
-
Imaging of brainstem and cerebellum
-
Early visual processing
-
Visual perception
-
Face processing
-
Attention
-
Music perception
-
Sleep
-
Eye movements
-
Somatosensation
-
Single trial variability
-
Patients
-
Data analysis overview
Face processing
To see the detailed figure legends hover the mouse over the figures
Early face specific brain response
Subjects passively viewed three categories of stimuli (faces, hands and shoes), which were presented to them at the centre and in each quadrant of visual field.

Early face specific response in FG. The activation time courses are averaged across
subjects in the left and right fusiform gyri (FG) for central (left) and peripheral (quadrants, right) visual
field presentations. The gray, shaded areas indicate significance higher than baseline (250 ms to 50 ms).
Red, faces; blue, hands; green, shoes. Three object-specific components were obtained: MFG100,
MFG170, and MFG200 in both the centre and the quadrants. In all responses, face stimuli
elicited higher activation than non-face stimuli at both central and peripheral presentation. a.u., arbitrary
units.
Compared to other categorical stimuli (hands and shoes) faces presented at the fovea and periphery produced significantly stronger responses in fusiform gyrus (FG) in three time periods - M100 (onset ~70 ms), M170 (onset ~130 ms) and M200 (onset ~200 ms). This study showed for the first time face specific response as early as 70 ms after stimulus onset.
Y. Okazaki et al., Neuroscience 152, 1130-1144 (2008). PDF >>
Connectivity pattern during face processing
In a face affect recognition task, faces with fearful, happy and neutral expressions were presented to subjects at the centre and in each quadrant of visual field.
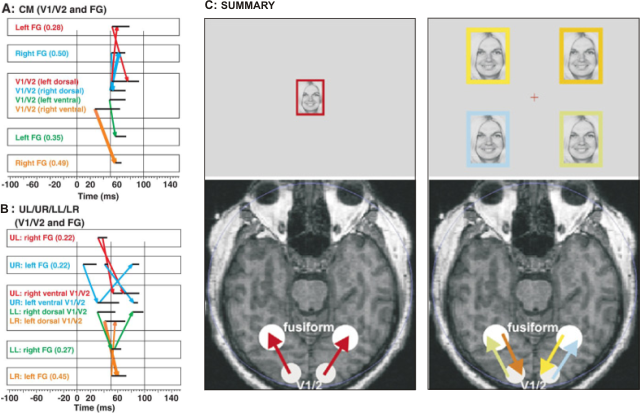
Connectivity pattern between V1/V2 and FG during face processing. (A and B) Mutual
information based influence diagrams for linked activity between V1/V2 and FG common to all eight subjects.
Regions of interest (ROIs) are arranged in successive rows and time flows from left to right with arrows
pointing from the first to the second activated area. ROI labels are printed inside each row with the numbers
denoting the maximum linkage strength between ROI1 (-50 to 100 ms) and ROI2 (-100 to 150 ms). (A) Linkages
for the central presentation between four V1/V2 ROIs (ROI1) and FG (ROI2) in the same hemisphere. (B)
Interactions between contralateral V1/V2 and FG for peripheral visual field presentations. Heavy arrows
denote the strongest linkage in each panel. UL, upper left quadrant; UR, upper right; LL, lower left; LR,
lower right. (C) Summary of figures A and B: Functional connectivity (mutual information
estimates of linked activity) between V1/V2 and FG for face stimuli presented either to the centre (left
column) or to one of the four quadrants (right column) of the visual field. The dominant first-linked
activity (arrow) is from V1/V2 to the FG for stimuli in the centre or the lower quadrants of the visual
field, but from the FG to V1/V2 for stimuli in the upper quadrants. The colour of the frame for each stimulus
corresponds to the colour of the relevant linked-activity arrow.
The analysis of functional connectivity (mutual information) between V1/V2 and fusiform gyrus (FG) showed that for faces presented at the centre and lower visual field, the dominant first functional link is from V1/V2 to FG. While for the upper visual field the direction of the information flow is reversed, the first linked activity was from FG to V1/V2. CM, centre middle; UL, upper left; UR, upper right; LL, lower left; LR, lower right.
L. C. Liu, A. A. Ioannides, Neuroimage 31, 1726-1740 (2008). PDF >>
Early emotion separation in the brain
In a face affect recognition task, faces with fearful, happy and neutral expressions were presented to subjects at the centre and in each quadrant of visual field (the same experiment as above).
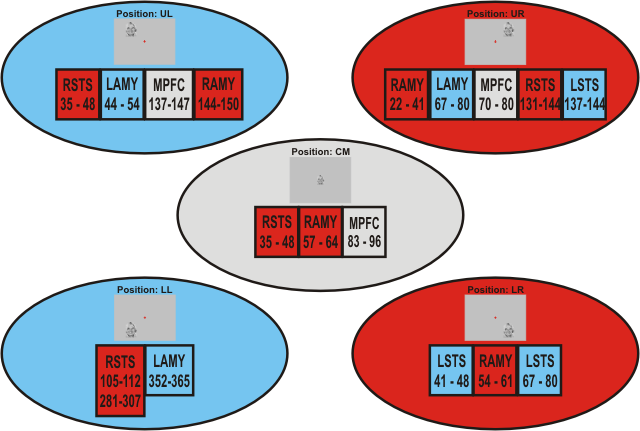
Time ranges for emotion separation in bilateral amygdala (AMY), superior temporal sulcus (STS),
and medial pre-frontal cortex (MPFC). The times are printed inside the boxes in millisecond. Images
were presented at either the centre or one of the quadrants. Gray, blue and red ovals represent fovea, left
and right visual field presentation, respectively. In case of STS and AMY activations, boxes in the same
colour as the background oval denote ipsilateral activity while in different colour denote contralateral
activity.
Here we show response latencies (in ms post-stimulus) and brain regions that first separate different emotions. The results show that the separation is processed differently depending on where in the visual field the stimulus is presented. Superior temporal sulcus (STS) and amygdala play key, but different roles in early visual processing, recruiting distinct neural networks for action: the amygdala alerts sub-cortical centers for appropriate autonomic system response for fight or flight decisions, while the STS facilitates more cognitive appraisal of situations and links appropriate cortical sites together. STS, superior temporal sulcus; RSTS, right STS; LSTS, left STS; AMY, amygdala; LAMY, left AMY; RAMY, right AMY; MPFC, medial pre-frontal cortex.
The separation at the upper right visual field appeared fastest among all the visual field presentations. This effective separation of emotions may be attributed to the tendency of leftward bias when holding a newborn young infant: a leftward held infant will have the face of its mother in the upper right quadrant of the visual field. The evolutionary pressure would thus have favoured selective pruning of connections supporting the analysis of the more frequently occurring encounters with the salient stimuli of the carer's face.
L. C. Liu, A. A. Ioannides, PLoS One 5, e9790 (2010). PDF >>