Related pages
In this section
-
Key findings
-
Source localization
-
Imaging of brainstem and cerebellum
-
Early visual processing
-
Visual perception
-
Face processing
-
Attention
-
Music perception
-
Sleep
-
Eye movements
-
Somatosensation
-
Single trial variability
-
Patients
-
Data analysis overview
Imaging of brainstem and cerebellar nuclei with MEG
The aim here is to explore the feasibility of detecting, sizing and clearly imaging different brainstem and cerebellar nuclei with MEG. As an example we will use data from somatosensory experiments.
Four normal right-handed subjects were studied, using electrical stimulation of the median nerve in each arm at the wrist. The intensity of the stimuli was set so as to produce a motor response of the thumb. Thus both sensory and antidromic motor volleys ascended to the cord. MFT (magnetic field tomography) was applied to the averaged and single trial signals. Regions of interest (ROI) were then defined by a combination of functional and anatomical criteria. After definition of the ROI their activation time courses were calculated for the different conditions.
Medulla and thalamus (VPL)
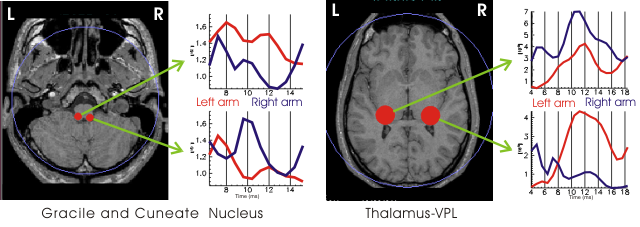
The left picture shows ROIs situated at the level of the cuneate and gracile nucleus on the right and left hand sides of the brainstem along with their average activation curves upon stimulation of left and right median nerve (average 3 subjects, 1000 trials each). Note how the activity is highest on the side of the ipsilateral arm (uncrossed). Timings are about 8-12 ms for left side but 9-11ms for the right side. The right picture shows ROIs at the level of ventral posterior lateral nucleus (VPL, one subject 1000 trials). On this occasion the activity as expected is contralateral to the side of stimulation and the timing is about 12 ms.
Anterior quadrangular (Culmen) cerebellar lobule
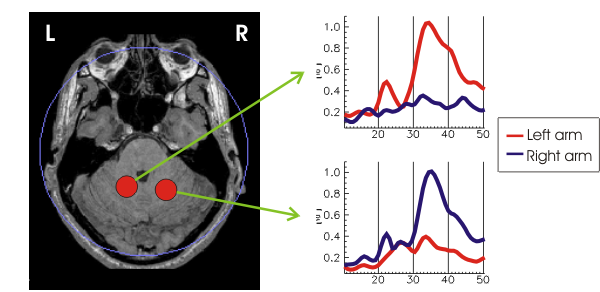
The axial MRI shows the ROIs placed on the anterior quadrangular lobule of the cerebellum, also receiving activity from the midline culmen. Average of 3 subjects 1000 trials each. On the left side, maximum activity is with ipsilateral stimulation at 34-35ms. On the right side again the peak is ipselateral to the stimulated arm and is at 35-36ms.
Gracile cerebellar lobule
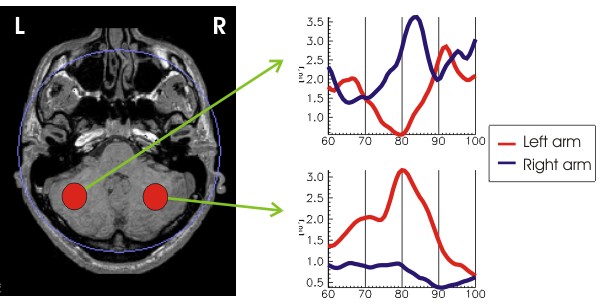
The axial MRI slices shows ROIs placed near to the cerebellar gracile lobule bi-laterally. The activity for one subject, 1000 trials, decorrelateted from SI. Prominent contralateral stimulation peaks are seen at 83 ms on the left and 80 ms on the right.
Brainstem and cerebellum
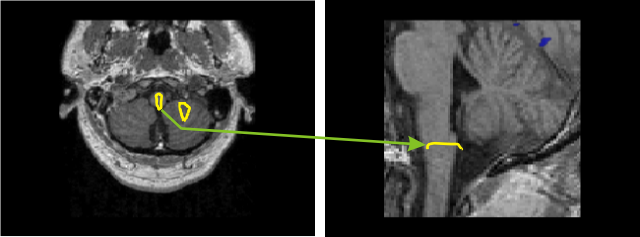
Statistical parametric map for left arm stimulation from 30 single trials (comparison to the pre-stimulus baseline, integrated over 200ms window, yellow contour P < 0.00005). Activity is seen in the gracile and cuneate nuclei and in the gracile lobe of the cerebellum, contralateral to stimulated arm. On the right sagittal MRI, the contour (P < 0.00005) is at the level of the gracile and cuneate nucleus.
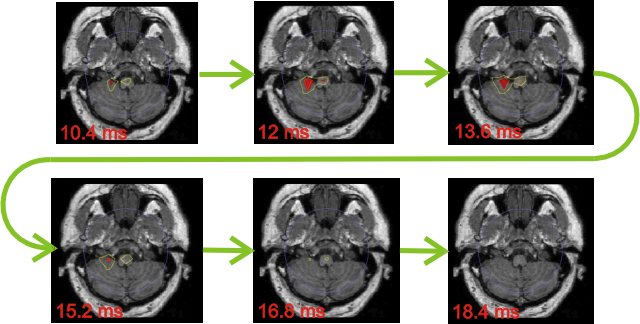
This set of axial MRIs shows the sensory volley ascending through the brainstem starting at 10.4 ms and ending at 18.4 ms. The spread in time reflects both the duration of the volley and variability across single trials. The contours encompass statistically significant activity, yellow for P < 10-5 and red for P < 10-7. The first 10 single trials for left arm stimulation are compared to the noise runs (runs with subject in place and no stimulation). Activity is significant in gracile and cuneus nuclei. And ipsilateral to the gracile cerebellar lobe. Note short activation of the cerebellum.